Technical support

How to read Crypto charts?
Like technical charts that assist traders to pick equities and commodities, crypto charts are used to make better investment decisions while dealing with cryptos.
Crypto charts are graphical representations of historical price, volumes, and time intervals. The charts form patterns based on the past price movements of the digital currency and are used to spot investment opportunities. To understand how to read a crypto chart, let's discuss a Japanese Candlestick chart.
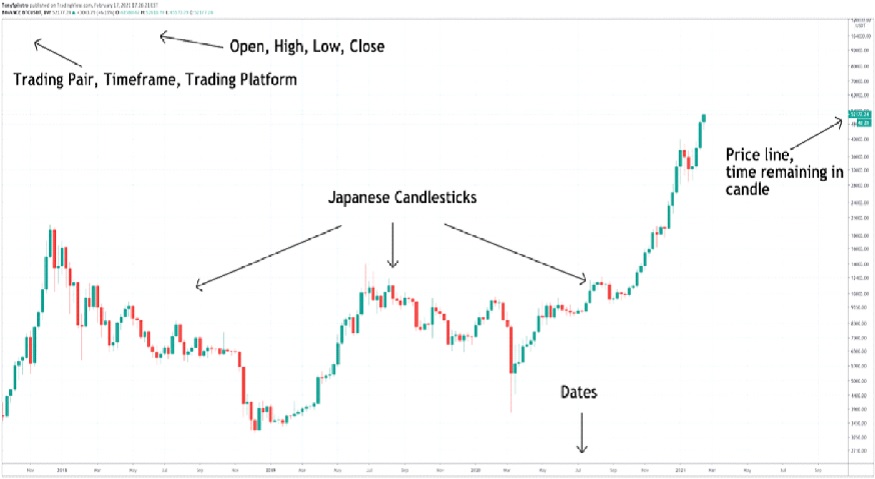
A Japanese Candlestick is among the frequently used charts by crypto traders. To interpret the image above, you should be aware that a candle is represented in red when the closing price is lower than the starting price during a specified time frame. This means the price of the asset declined. In contrast, the green candle shows that the closing price was greater than the starting price. This indicates that the asset’s price rose. These candlestick charts form several patterns. Depending on the shape, colour and size of the candlestick, traders take positions or make changes in their trading strategies.
Bullish and Bearish Patterns
Patterns formed on the charts fall into two categories: Bullish Reversal Patterns and Bearish Reversal Patterns. For instance, a Hammer Candle Pattern is a bullish reversal pattern which tells us that a stock is nearing bottom in a downtrend. The body of the candle is short which represents the head of the hammer while the longer wick is a sign that sellers are driving prices low during a trading session, which would be followed by strong buying pressure to end the session on a higher dose. The upward trend must be confirmed by watching it closely for a couple of days and the reversal should also be validated by a rise in trading volume.
Shooting Star Candle Pattern
A shooting star candle pattern is a bearish reversal pattern that occurs at the height of a rally before reversing down. This pattern consists of a candle with a long upper wick and a small body, as can be seen in the image above. A shooting star candle pattern indicates drive-by buyers which are met by resistance.
Popular patterns for technical analysis
Head and Shoulders
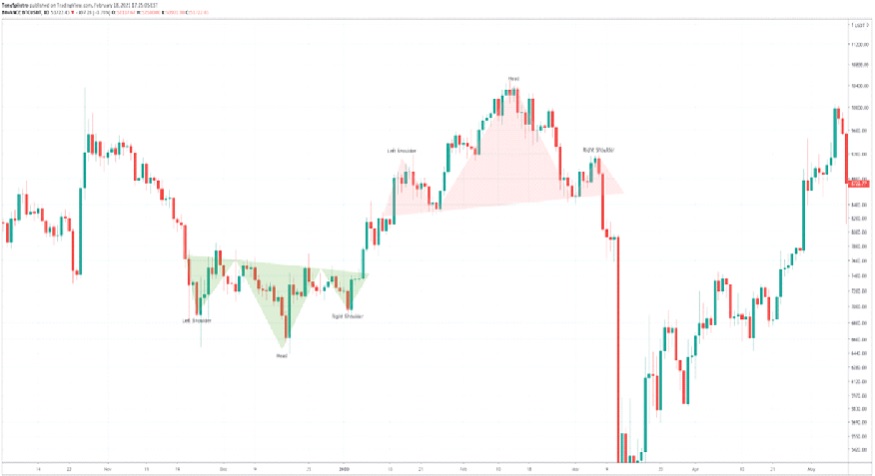
Head and shoulders patterns are reversal patterns that may show up at the peak or bottom of an ongoing trend. If such a pattern shows up near the bottom of a trend, it's called an inverted head and shoulders pattern. These patterns show a tug of war between buyers and sellers, with one side finally coming on top, resulting in a greater pushback or pullback.
Wedges
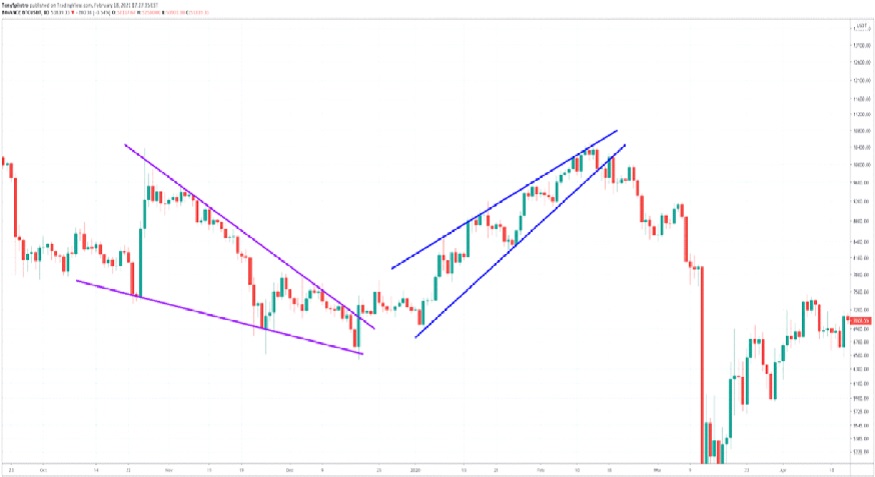
The pattern that is formed in the above image is a wedge. They appear when a trend starts to settle down and finally results in a breakout. Markets often move sideways to wedge back and forth until they move into a firm direction.
Support and Resistance
Understanding support and resistance are one of the most crucial parts of reading a crypto chart. Support levels in charts refer to a price level that the asset does not fall below for a fixed period. In contrast, resistance level refers to the price at which the asset is not expected to rise any higher. This is the level at which the sellers outnumber buyers in the market for a particular digital asset. Experts are known to suggest support and resistance levels to assist traders while taking positions in crypto.
Conclusion
Understanding the patterns would help traders make an informed decision. However, trading in crypto requires an efficient trading platform. WazirX is one such platform where you can not only take positions but also effortlessly spot these patterns and indicators every day.
https://wazirx.com/blog/how-to-read-crypto-charts/
https://wazirx.com/exchange/WRX-INR


Comments
Post a Comment